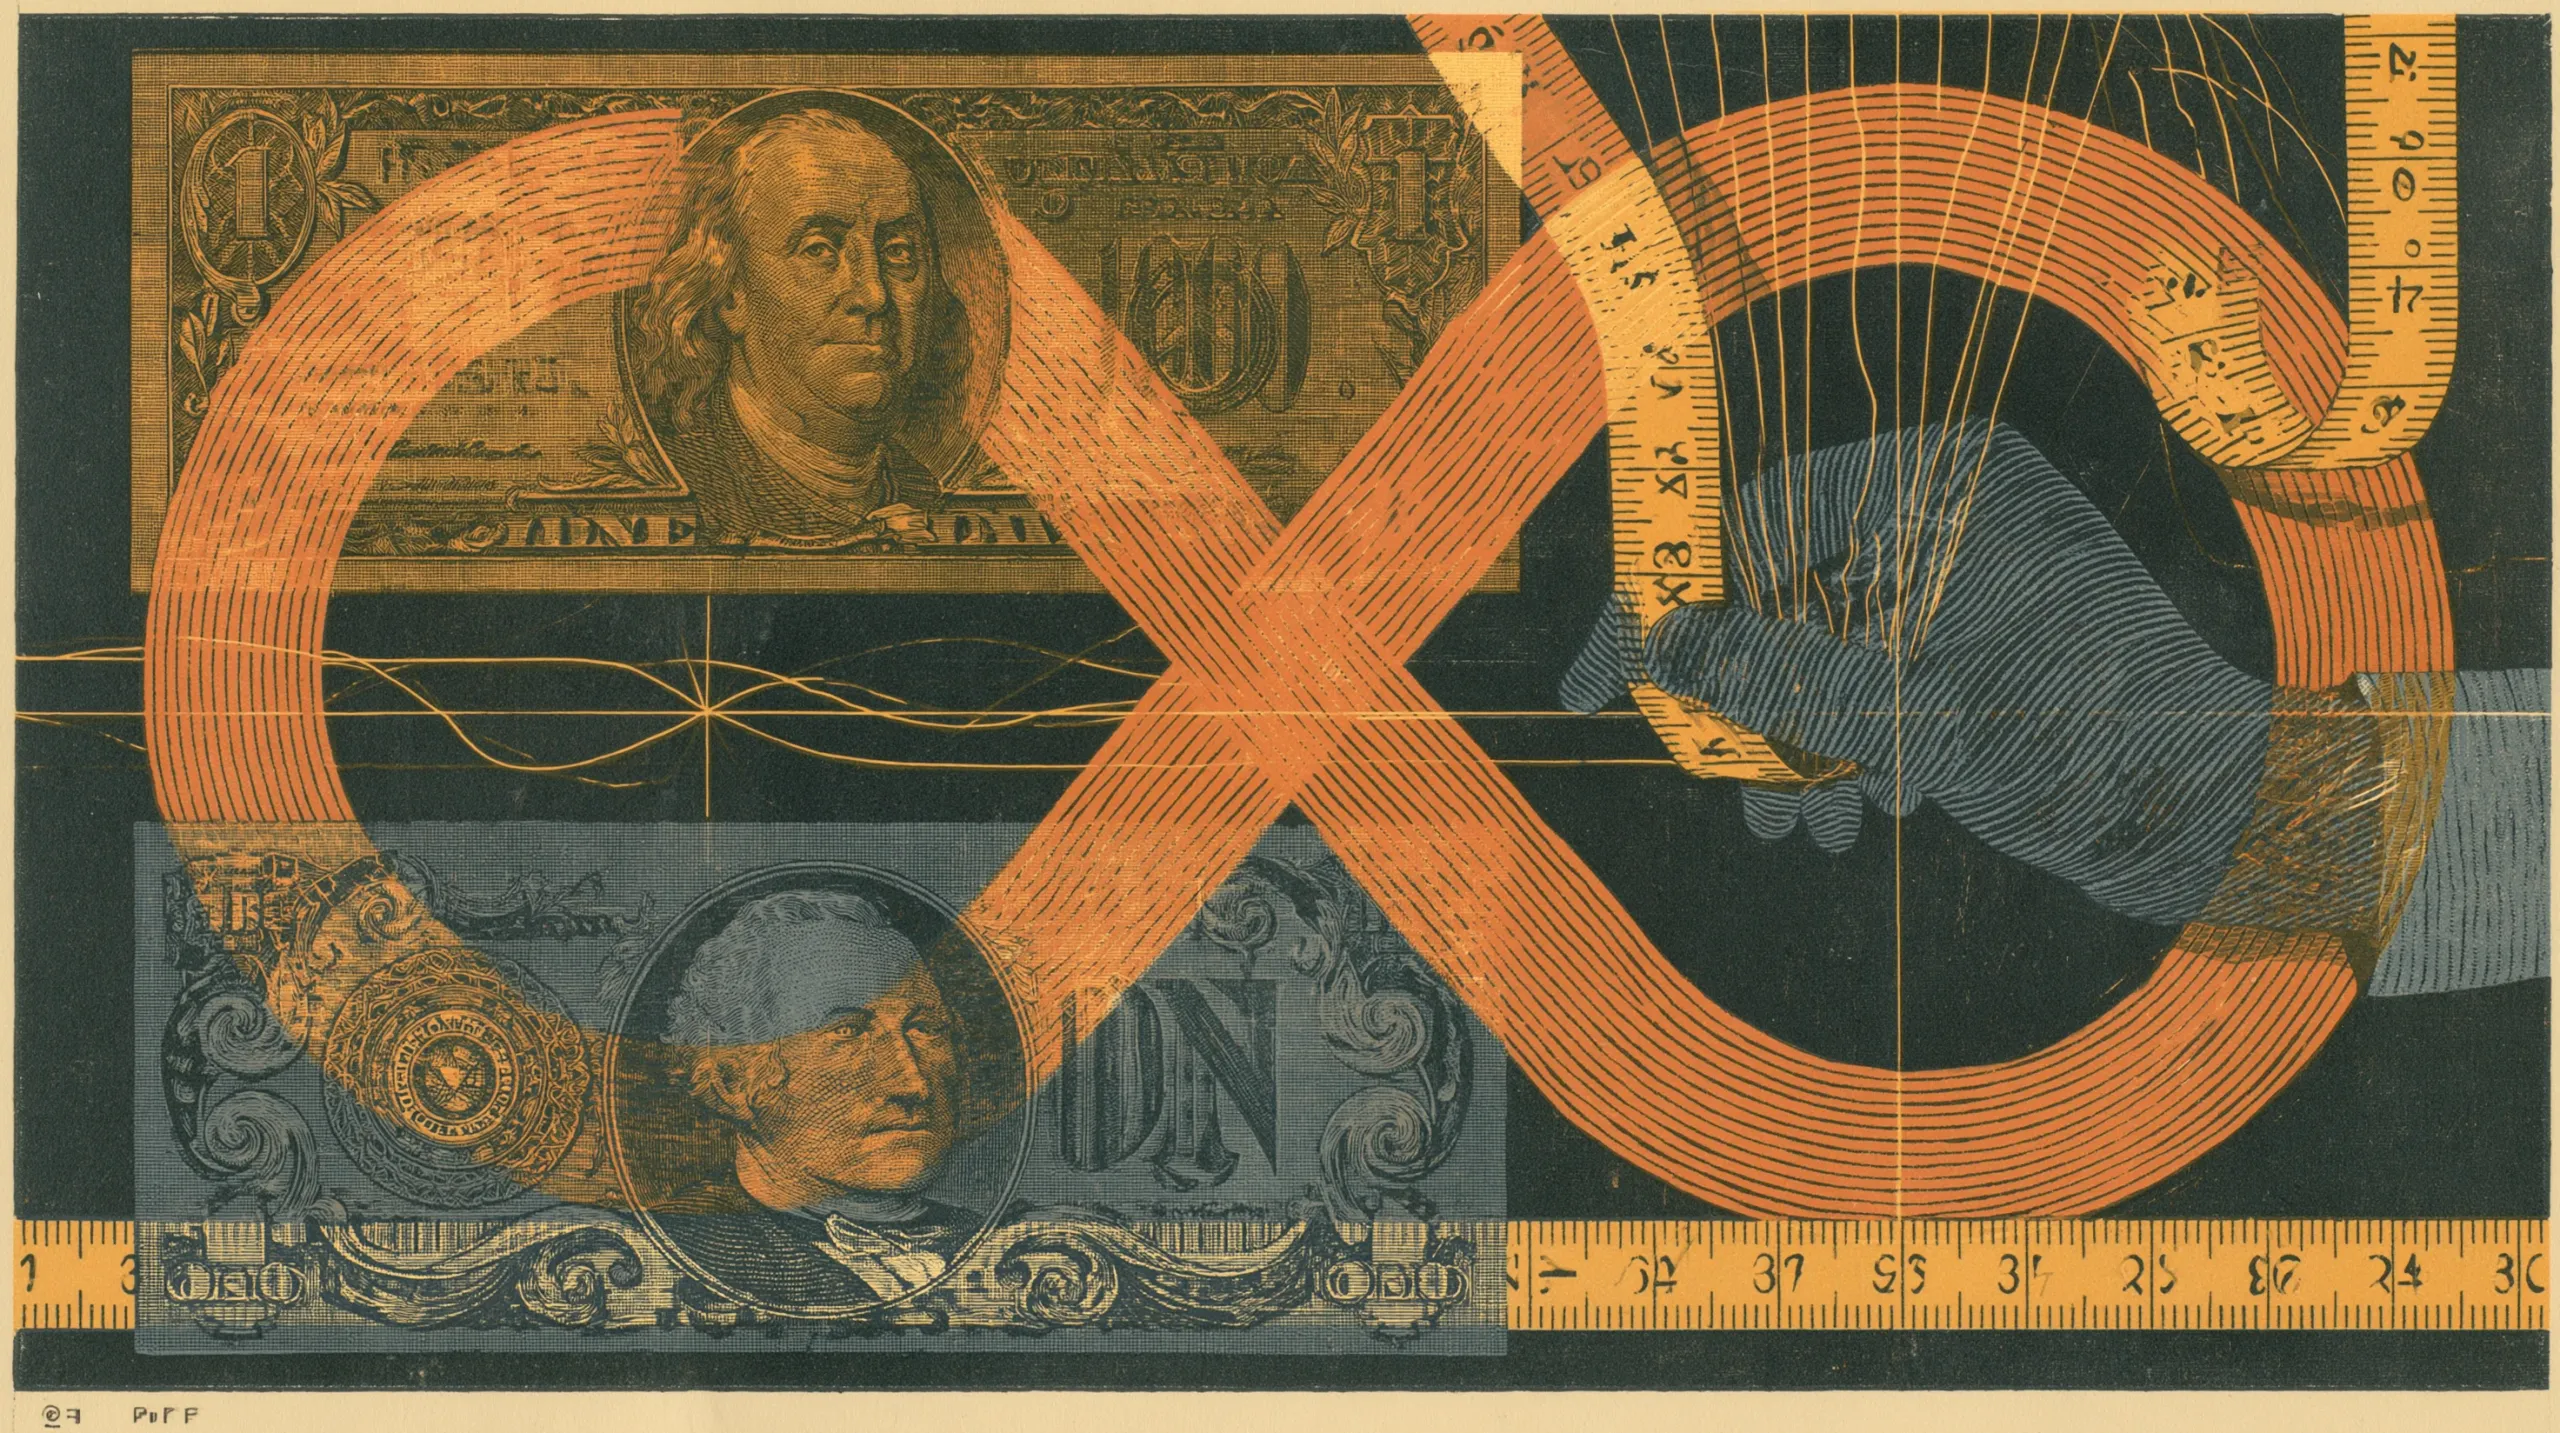
When every money figure you’ve ever read about the economy is written in a unit whose supply moves, what changes is perception. The unit is the ruler that stretches while you measure.
Every number you’ve ever read about the economy that’s a sum of money was written in a unit that was changing while you read it. Your first payslip, your parents’ house price, the GDP charts in your textbooks, and the “record highs” in the news were all written in pounds or dollars, and across the post-war decades, the supply of pounds and dollars was higher at each decade’s end than at its start.1 That’s the fact underneath all the others, so far down that almost nobody ever looks at it.
The instrument you see with
The money you spend does more than pay for things. It’s the unit that prices and debts are written in. It’s also the instrument you see the economy with. When the supply of that unit moves, that movement doesn’t show up as an error you can spot. It disappears into the measurements themselves. Two measures built in the same unit can disagree, and the disagreement gets published, but it can’t tell you the unit moved. You don’t perceive a distorted world. What you perceive hangs together. It reads as the ordinary way of things, not as a fault in the instrument. And it’s wrong about what changed. And because almost every check you’re likely to run is written in the same unit, the world keeps confirming itself.
That’s the root of why nobody sees the distortion. It isn’t stupidity, and it isn’t a conspiracy. There’s never been a fixed point outside the unit to stand on. You can’t measure a ruler’s own movement with that ruler.
What happens to perception
Three things pile up.
First, the sign flips. When the money is being expanded, a thing that hasn’t changed, or has got cheaper to make, can look as if it’s gone up. Your house “doubles” over ten years and you feel richer. But the house didn’t change. It has the same rooms, the same roof. What changed is that each pound measures less, so the same house takes more of them. Meanwhile you still have to live somewhere, and the house you’d move into costs more as well. The tax and upkeep climbed too. The gain you perceive is mostly the ruler shrinking. Same with your pay. A 3% rise reads as progress. If your food, rent, and energy rose 8%, you took a pay cut, and your perception recorded it as a raise. Rising prices and a wage that buys less are one phenomenon seen from opposite sides. At a standing rate of a few percent a year, the unit keeps the two sides apart, so the gain arrives as news and the loss arrives as a squeeze with no day, no amount and nobody to name. When the rate runs high, people do name rising prices and blame the government and firms, and the half nobody traces is still the price fall that never arrived. That’s why the illusion is so stable. The half you notice is the half that flatters you, and at a few percent a year the half that hurts never leads back to the ruler. People don’t defend the truth of their instruments. They defend the instruments that tell them they’re winning.
Second, the baseline vanishes. Even people who accept that inflation exists miss this part. The natural state of a free market, under a money nobody can add to, is falling prices, because when tools improve, the same goods take fewer inputs to make, and competition passes that saving on. So the honest baseline is minus something rather than zero. On the published figures it’s minus a point or two a year. With software and AI, that fall will get bigger. Measured against that baseline, flat prices aren’t stability. Flat prices mean most of the price fall that year’s better tools should have delivered was absorbed by money creation. The gain from the better tools is real. Part of it reaches you as higher pay, late and unevenly.2 Part of it reaches you as better goods for the same money, and the inflation figures record only part of that.3 The part that doesn’t reach you goes to whoever got the new money first, through house and share prices.4 The weekly shop that should have got cheaper this year cost the same instead, and a bill that hasn’t moved gives you nothing to notice. Perception needs contrast, and the theft removes the contrast a person could feel. The contrast between goods is published, and so are estimates of what the index misses, but neither of those is the fall your own bill didn’t show.5 Nobody mourns the price fall that never happened. The crime scene is a world that never existed, so there’s nothing to point at.
Third, the correction tools inherit the error. This is what closes the loop. You might say we know about inflation, and that’s why we have “real terms” figures. But the adjustment is done with an index built in the same unit, and that unit is managed to hit a target the same index is used to score. The 2% target makes this worse. Once a measurement becomes the goal, the system is managed to hit the number, the way a school that decides the average grade must be a B scales every test until it is. And the deeper distortion never enters the index at all, because the official price index, the CPI, measures against zero, not against the falling-price baseline that technology keeps delivering.
The price index leaves out the price fall that didn’t arrive, and GDP [the official tally of money spent] leaves out the spending that left when a priced thing became free, so the same gain goes unrecorded from both sides. Neither measure breaks its own rule by leaving the gain out. The gain is outside both rules. That makes both a poor guide to what technology delivered. When your phone swallowed the camera, the map, the sat nav, and the postage, your life got cheaper and GDP recorded almost nothing, because GDP counts what was paid for, plus a short list of items priced as if they’d been paid for, and it doesn’t count what a thing is worth to the person using it above what they paid.6 GDP inherits the same error as well. Turning it into “real” growth takes another index, built in the same unit against the same zero, so money borrowed into existence and spent reads as growth.7 So the two official instruments this section has walked through are blind in both places where the distortion lands.
What this does to people
Money is information. It’s the signal you use to decide what your time is worth, what to build, whether you’re getting ahead. Distort the signal and you distort the choices.
A saver looks at cash losing to everything and concludes, correctly within the frame, that saving is for losers. Holding cash at a loss pushes everyone toward risk just to stand still. Many can’t save enough to follow, so the direct moves into let property and funds stay a minority. A worker feels the squeeze but can’t see the cause, because the mechanism hides inside the unit itself, so it never shows up as a line on any bill. So the anger lands on whatever is visible, the landlord, the boss, the immigrant, the other party. The resentment between labour and capital that dominates politics is largely misdirected, a fight over who stole the gains, conducted by people who can’t see that the gains were absorbed in the money itself, before either side could bargain over them. Our money system takes the price falls technology would deliver and replaces them with rising costs in the things people must buy, housing most of all, which manufactures the feeling of scarcity in the most productive era so far. Part of the rise in care, health, and education would have happened under any money, because better tools have changed those jobs less. People fight over fake scarcity just as hard as real scarcity.
Perception depends on the unit you think in. It seals itself against any check you run in the same unit. Someone who thinks entirely in pounds sees prices relentlessly rising. Someone holding bitcoin but still thinking in pounds sees a volatile asset “going up”. Someone who thinks in bitcoin sees the same houses, laptops, and flights getting cheaper cycle after cycle. Each of the three observers sees a world that hangs together and is confirmed by its own data. Even the words carry the unit inside them. An everyday phrase that reports a price move names only the thing, so it states the unit’s move as the thing’s move, from a house that “doubles” to an asset “going up”. Argument can’t settle which observer is right while every figure is written in a money, because each figure carries its own unit’s movement. A ratio that cancels the money, like a house in years of median pay, settles that one good against that one denominator and nothing wider, because a claim about the general level needs a basket and a weighting, and both are choices.
Why the slowness matters
How fast the money loses value is a large part of what decides whether people can name the loss, meaning the day, the amount and who did it. It isn’t what decides whether rising prices get noticed at all. In July 2024 Ethiopia’s central bank cut the birr’s official value by nearly a quarter in a day, from 57 to 75 against the dollar, and let it float from there.8 Shop prices jumped within the week, and by the start of August the authorities were closing shops for raising them, because the stretch happened all at once and everyone could see it, the state included. Measured on money held, 2% a year compounds over thirty years into a loss of buying power of about 45%, which is bigger than a one-day cut of a quarter in the exchange rate, and there’s no day to point at. The hidden gap to the falling-price baseline, which is a point or two a year on the published figures, adds to that. Part of that fall did arrive, as better goods for the same money, and the index records only part of that.9 The sum counts what never arrived. What any one household loses depends on what it holds. Nothing ever happens. Your savings are never seized. There’s no line item, no event, and human perception is built on events. We also think in straight lines, so a small yearly stretch that compounds for a generation is doubly invisible. It’s too slow to alarm you, and it compounds in a way our minds don’t expect. By the time you’re an adult, the stretching ruler is the water you learned to swim in. Every memory you have of “what things cost” was laid down in it.
Where the fixed ruler comes in
This is why the measurement question, not the investment question, is where bitcoin enters the thesis. A measurement needs an independent variable, a reference whose definition and quantity the thing being measured can’t change. For the first time the unit itself is one whose supply no single party can change.10 If you hold it directly, you can check that for yourself. It keeps that property only while the network stays decentralised and secure. If you take a claim on a custodian instead, you’re back to a quantity someone else can change. Measured against that ruler across the cycles so far, the picture flips. Inside a single year it can run the other way, and the windows that end at a cycle low are where it does. A family home that took roughly 300 bitcoin in 2017 took roughly 40 in late 2021, and by the end of 2025 it had fallen further, while its pound price rose. The whole of that fall is the new unit coming to buy more as more people take it up, not houses getting cheaper to build. In pounds the house got dearer, so cheaper houses can’t be any part of the explanation. The house didn’t change. Both numbers did, in opposite directions, which makes it a fact about the two rulers and not about houses. The new unit coming to buy more is the loud part while the world is still moving into it. Underneath that loud part runs the slower fall technology has been delivering all along, the one the old unit hid. Measured against the fixed ruler, most things have got cheaper cycle after cycle. Over the longest window there is, from 2010 on, nearly everything has got cheaper against it. Bitcoin “going up” and everything “getting more expensive” turn out to be the same optical illusion, seen through the moving unit. The point isn’t the price. A second unit whose supply no committee can change lets you see the first one move without trusting an index built in the first unit. There are other ways to see it, and there were earlier ones. The second unit is the first reference that isn’t changed by what it measures.
You can’t argue a mind out of a frame using numbers stated inside the frame. Every price and every total arrives already written in a unit, and the mind will file it back into the old unit. What works is starting from the instrument. Take a second ruler and re-measure one thing you already know intimately, your own house or your own payslip, and let the flip happen in your hands. Re-measurement opens the frame when that one thing is recorded in both units across several dates, because what shows is the direction and not the size of the number. Keeping that record going over the years holds the frame open.
The arguments against this, and the unit they’re made in
“Official real-terms figures already correct for this.” The price index does read the stretch of the pound against the goods it prices. What it can’t read is the fall those goods would have shown under a unit nobody can expand, because its adjustments are made in the same stretched pound. It corrects against the wrong baseline, using baskets that give too little weight to the things people must hold, like housing.11 The correction is sincere and it’s circular.
“Markets gather everyone’s information into prices, so a distortion this large would be traded away.” Markets gather that information in the unit. And the anchor of every valuation, the so-called risk-free rate on government debt, is pushed below where free buyers and sellers would set it, so every price worked out from that rate bends with it. You can’t trade the unit away from inside the unit.
“Bitcoin is far too volatile to be a ruler.” Today’s volatility is a small, young asset repricing the whole world, and it’s measured in the stretching unit. The property a measure needs is a supply no committee can change. A calm chart was never the test. And on the record so far, from one cycle to the next, the direction of prices in the fixed unit has been consistent, and it points down.
So when every money figure you’ve ever read about the economy is written in a unit whose supply moves, perception succeeds at seeing a false world, and the illusion recruits your own gains, your own language, and your own correction tools to keep it false. The ruler that stretches while you measure doesn’t just mismeasure the plank. It convinces the carpenter he’s getting taller.
Sources 11
What this essay rests on, as checked on 11 November 2026.
- 1 Board of Governors of the Federal Reserve System, H.6 Money Stock Measures, M2, seasonally adjusted (series M2SL), monthly to August 2026: M2, billions of dollars, seasonally adjusted, at each decade start: 1959-01 286.6; 1970 589.6; 1980 1,482.7; 1990 3,166.3; 2000 4,666.1; 2010 8,473.1; 2020 15,425.0; 2026-08 23,342.8. The series starts January 1959 and covers dollars only, not pounds.
- 2 Stansbury and Summers, National Bureau of Economic Research working paper 24165, “Productivity and Pay: Is the link broken?”, 2017: “over 1973-2016, one percentage point higher productivity growth has been associated with 0.7 to 1 percentage points higher median and average compensation growth”; “other factors orthogonal to productivity have been acting to suppress typical compensation”. Pessoa and Van Reenen, Centre for Economic Performance discussion paper 1246, “Decoupling of Wage Growth and Productivity Growth? Myth and Reality”, October 2013: “In the UK net decoupling is basically zero: both wages and productivity rose by the same amount since 1972.” UK, 1972 to 2010: “real productivity grew by 114 per cent” and “median real wages by 72 per cent”.
- 3 Aghion, Bergeaud, Boppart, Klenow and Li, “Missing Growth from Creative Destruction”, American Economic Review, volume 109, number 8, August 2019: “For exiting products, statistical agencies often impute inflation from surviving products. This understates growth if creatively-destroyed products improve more than surviving ones.” Missing growth “equaled about one-half a percentage point per year”, United States non-farm businesses, 1983 to 2013. The published article prints about one-half a percentage point per year; the 0.6 figure is the headline of the earlier working paper.
- 4 Richard Cantillon, “Essai sur la Nature du Commerce en Général”, 1755, Part II, Chapter VI, “Of the increase and decrease in the quantity of hard money in a State”: “the Proprietors of these Mines, the Undertakers, and all those who work there, will not fail to increase their expenses in proportion to the wealth and profit they make”. The passage is about new mine money first raising those people's spending; it prints nothing about house or share prices.
- 5 U.S. Bureau of Labor Statistics, The Economics Daily, “Long-term price trends for computers, TVs, and related items”, 13 October 2015: “The price index for TVs decreased 94 percent from December 1997 to August 2015.” “the price index for cable and satellite television and radio service increased 80 percent from December 1997 to August 2015.” Aghion, Bergeaud, Boppart, Klenow and Li, “Missing Growth from Creative Destruction”, American Economic Review, volume 109, number 8, August 2019: “For exiting products, statistical agencies often impute inflation from surviving products. This understates growth if creatively-destroyed products improve more than surviving ones.” Missing growth “equaled about one-half a percentage point per year”, 1983 to 2013. The published article prints about one-half a percentage point per year; the 0.6 figure is the headline of the earlier working paper.
- 6 Australian Bureau of Statistics, Australian System of National Accounts: Concepts, Sources and Methods, 2020-21, Chapter 23, “Unpaid work”, quoting System of National Accounts 2008 paragraph 6.27: “the production of all goods and services that are supplied to units other than their producers” and “the own-account production of all goods that are retained by their producers for their own final consumption” Office for National Statistics, Changes to National Accounts: imputed rental, 23 March 2016: “It can be thought of as the amount that non-renters pay themselves for the housing services that they produce.” “Imputed rental represents around 10% of GDP as measured by expenditure.” Brynjolfsson, Collis, Diewert, Fox and Eggers, NBER working paper 25695, “GDP-B: Accounting for the Value of New and Free Goods in the Digital Economy”, March 2019: “The welfare contributions of the digital economy, characterized by the proliferation of new and free goods, are not well-measured in our current national accounts”; the paper “introduce[s] a new metric, GDP-B which quantifies their benefits, rather than costs”.
- 7 ONS, Chain-linking methods used within the UK National Accounts: “If a suitable deflator (or equivalently referred to as a price index) exists” … “The resultant time-series of production figures has the effects of price changes removed.”
- 8 International Monetary Fund, Press release, “IMF Executive Board Approves Four-Year US$3.4 billion Extended Credit Facility Arrangement for Ethiopia”, 29 July 2024: "The Executive Board approved an SDR 2.556 billion (about US$3.4 billion) ECF arrangement for Ethiopia"; "Move to a market-determined exchange rate to help address external imbalances and relieve FX shortages"; approved July 29, 2024.
- 9 Lebow and Rudd, “Measurement Error in the Consumer Price Index: Where Do We Stand?”, Journal of Economic Literature, March 2003: “We estimate that the CPI currently overstates the rate of change in the cost of living by about 0.9 percentage point per year, with a confidence interval ranging from 0.3 to 1.4 percentage points.” Brent Moulton, “The Measurement of Output, Prices, and Productivity: What's Changed Since the Boskin Commission?”, Brookings Hutchins Center, 25 July 2018: Overall CPI bias “has fallen from about 1.1 percent to about 0.85 percent today” (July 2018); in 1996 the Boskin Commission put the CPI's “upward bias of 1.1 percentage points per year, with a plausible range of 0.8 to 1.6 percentage points”. Aghion, Bergeaud, Boppart, Klenow and Li, “Missing Growth from Creative Destruction”, American Economic Review, volume 109, number 8, August 2019: “For exiting products, statistical agencies often impute inflation from surviving products.” “We find missing growth (i) equaled about one-half a percentage point per year”, United States non-farm businesses, 1983 to 2013.
- 10 Nakamoto, “Bitcoin: A Peer-to-Peer Electronic Cash System”, 2008: "there is no central authority to issue them"; "Once a predetermined number of coins have entered circulation, the incentive can transition entirely to transaction fees and be completely inflation free." Bitcoin Core (the published consensus rules), Bitcoin Core source file src/consensus/amount.h, master branch: Code: "inline constexpr CAmount MAX_MONEY{21'000'000 * COIN};" with the comment "No amount larger than this (in satoshi) is valid. Note that this constant is *not* the total money supply ... but rather a sanity check."
- 11 Paul Johnson, UK Statistics Authority, UK Consumer Price Statistics: A Review, published 8 January 2015: "Paul Johnson's report finds that, other than not accounting for owner occupiers' housing costs, the Consumer Prices Index (CPI) is a well constructed measure of inflation." The review prints the omission of owner occupiers' housing costs and otherwise calls the CPI well constructed; it does not say basket weights are too low.